


The market · trailing 12 months
Seabrook, Kiawah and Johns Island by the numbers
Monthly figures from CHS Regional MLS, pulled once a month. Totals and medians only — never a listing, an address or an agent.
Last verified
Photo: olekinderhook, CC BY 3.0, via Wikimedia Commons (resized)
Johns Island is the volume market: 846 residential sales in the 12 months through September 2026(+8.7% on the year before), $704M in volume, at 98.3% of list price on average.
Based on information from CHS Regional MLS for the period 10/01/2025 through 09/30/2026.
Johns Island
Based on information from CHS Regional MLS for the period 10/01/2025 through 09/30/2026.
See the numbers
| Month | sales |
|---|---|
| October 2025 | 64 |
| November 2025 | 56 |
| December 2025 | 64 |
| January 2026 | 55 |
| February 2026 | 56 |
| March 2026 | 83 |
| April 2026 | 71 |
| May 2026 | 96 |
| June 2026 | 87 |
| July 2026 | 80 |
| August 2026 | 73 |
| September 2026 | 61 |
Based on information from CHS Regional MLS for the period 10/01/2025 through 09/30/2026.
Average days on market 51; median active list price in September $675,000. Neighborhood by neighborhood: the directory.
Seabrook Island
Based on information from CHS Regional MLS for the period 10/01/2025 through 09/30/2026.
Median sale, 12 months, by kind
Based on information from CHS Regional MLS for the period 10/13/2025 through 10/13/2026.
See the numbers
| Month | sales |
|---|---|
| October 2025 | 13 |
| November 2025 | 9 |
| December 2025 | 17 |
| January 2026 | 9 |
| February 2026 | 14 |
| March 2026 | 15 |
| April 2026 | 14 |
| May 2026 | 17 |
| June 2026 | 22 |
| July 2026 | 10 |
| August 2026 | 18 |
| September 2026 | 14 |
Based on information from CHS Regional MLS for the period 10/01/2025 through 09/30/2026.
Average days on market 82; median active list price in September $638,500.
Kiawah Island
MLS-listed sales only. Much of Kiawah's dollar volume runs through the developer's brokerage, and its sales largely don't appear in these numbers.
Based on information from CHS Regional MLS for the period 10/01/2025 through 09/30/2026.
Median sale, 12 months, by kind
Based on information from CHS Regional MLS for the period 10/13/2025 through 10/13/2026.
See the numbers
| Month | sales |
|---|---|
| October 2025 | 4 |
| November 2025 | 9 |
| December 2025 | 10 |
| January 2026 | 6 |
| February 2026 | 5 |
| March 2026 | 22 |
| April 2026 | 18 |
| May 2026 | 15 |
| June 2026 | 11 |
| July 2026 | 12 |
| August 2026 | 13 |
| September 2026 | 13 |
Based on information from CHS Regional MLS for the period 10/01/2025 through 09/30/2026.
Average days on market 51; median active list price in September $1,509,500.
MLS figures are aggregates of listings as entered by agents, deemed reliable but not guaranteed. No listing, address or agent is shown. Monthly medians swing with the mix of houses and villas sold, so the headline uses 12-month totals.
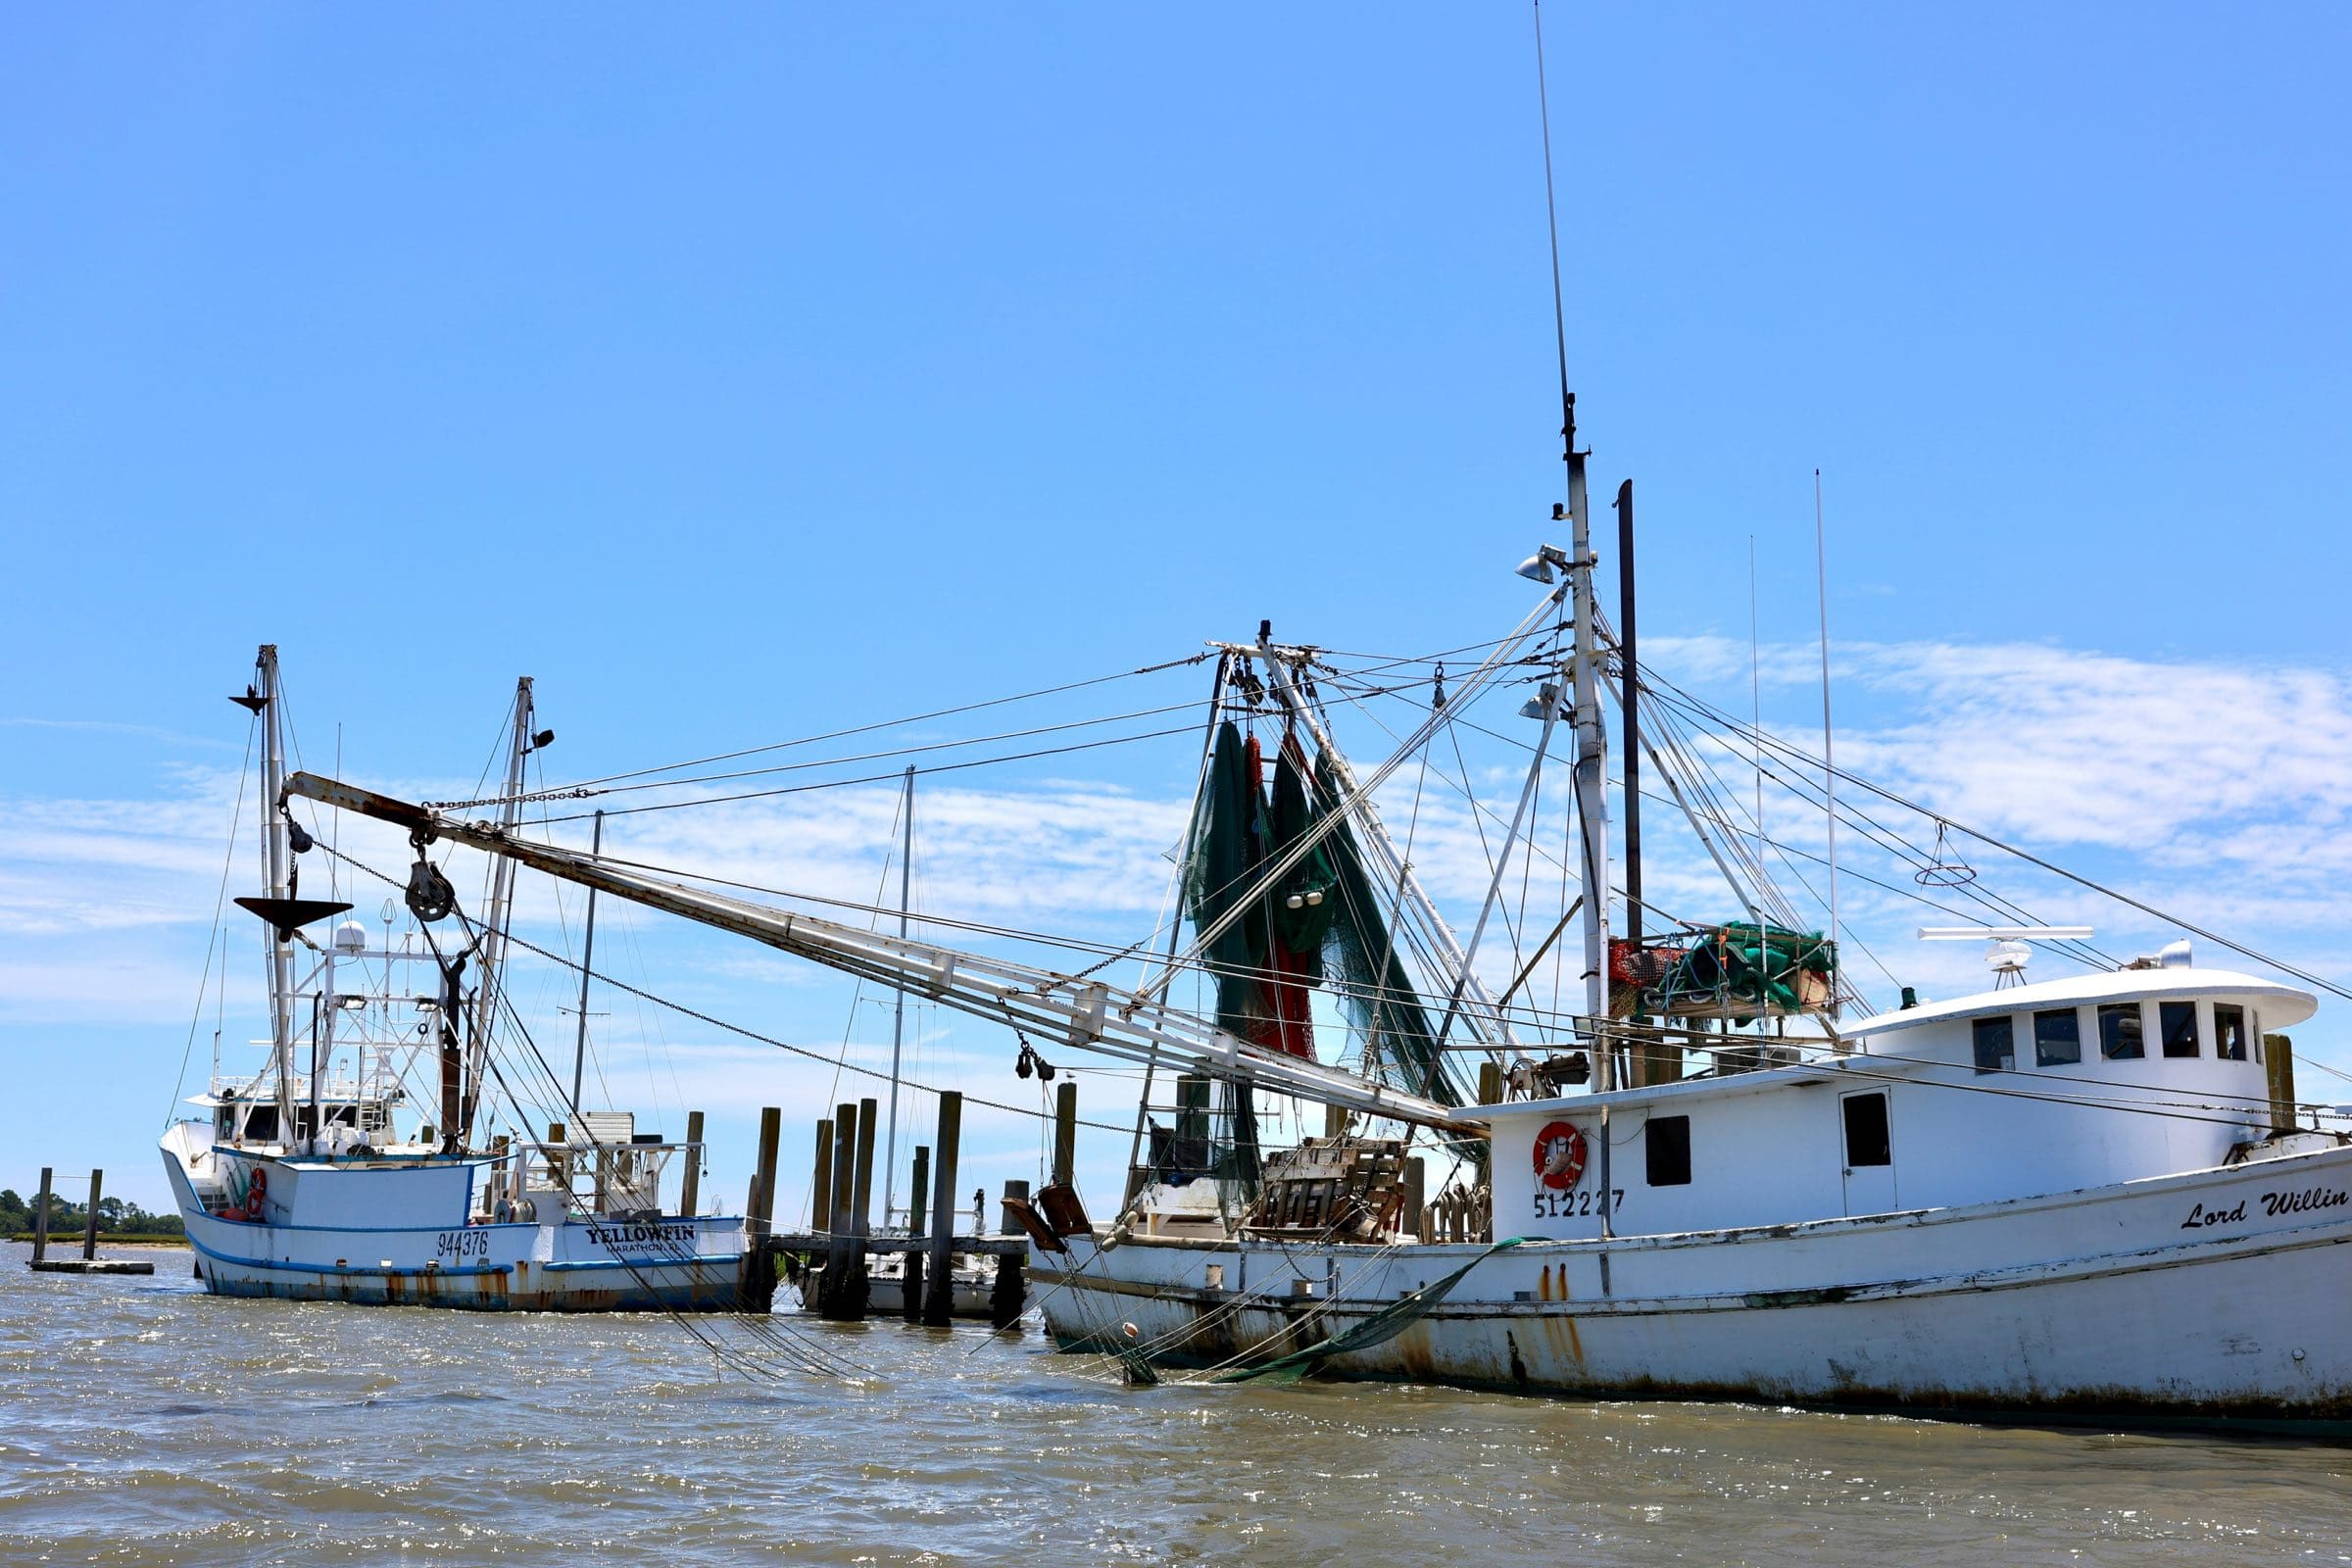
Shrimp boats, Lowcountry
Photo by Scott Greer on Unsplash
Two ways in
Talk it through with Mike, or ask Val — the guide’s AI assistant, answering from this site’s sourced facts.